
TL;DR:
Industries Use iconik Differently and Trust the Hybrid Cloud with Their Media
- Across 12 industries, video accounted for between 41%-78% of the 9.6M assets in iconik.
- iconik manages about 14 years worth of video, and 4.5 years of audio.
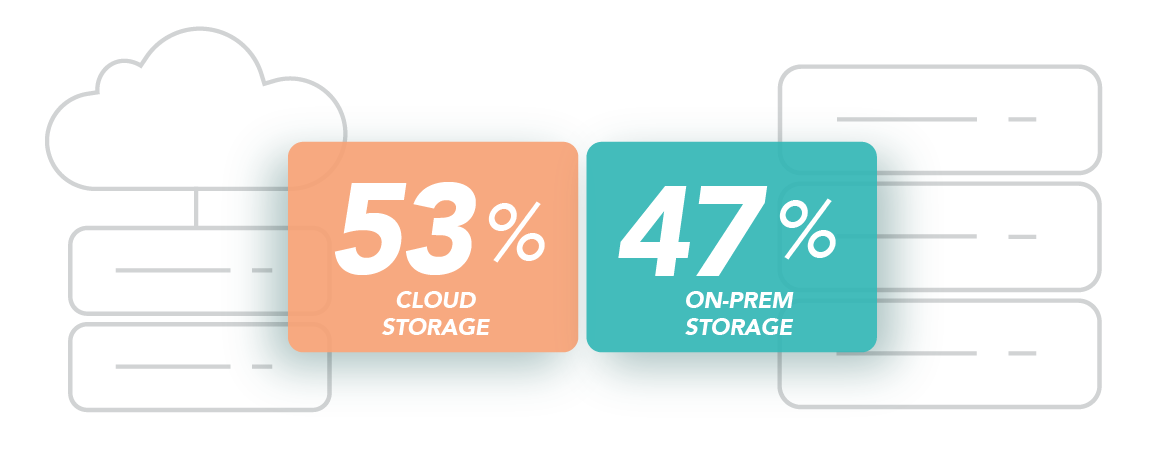
- iconik customers are using the hybrid cloud with 53% of their original assets in cloud storage and 47% on premise.
- 35% of assets in iconik are non-media. Customers are managing many types of files with the standard features in iconik.
Why Share the Data?
As a media-tech company, we have found that external data about our industry is hard to come by. We want to change that by being open and transparent about what we learn on our journey with iconik. Like a lot of companies, we want to gather as many data points as we can to help drive our decisions. By sharing this information, we hope to spark conversation and provide insights that will assist you too.
More Growth, More Data
2018 was the year that iconik powerfully confirmed its product-market fit. And by every measurement, 2019 was a year of growth. Between the end of September through December, iconik doubled the number of assets it managed without any changes in performance.
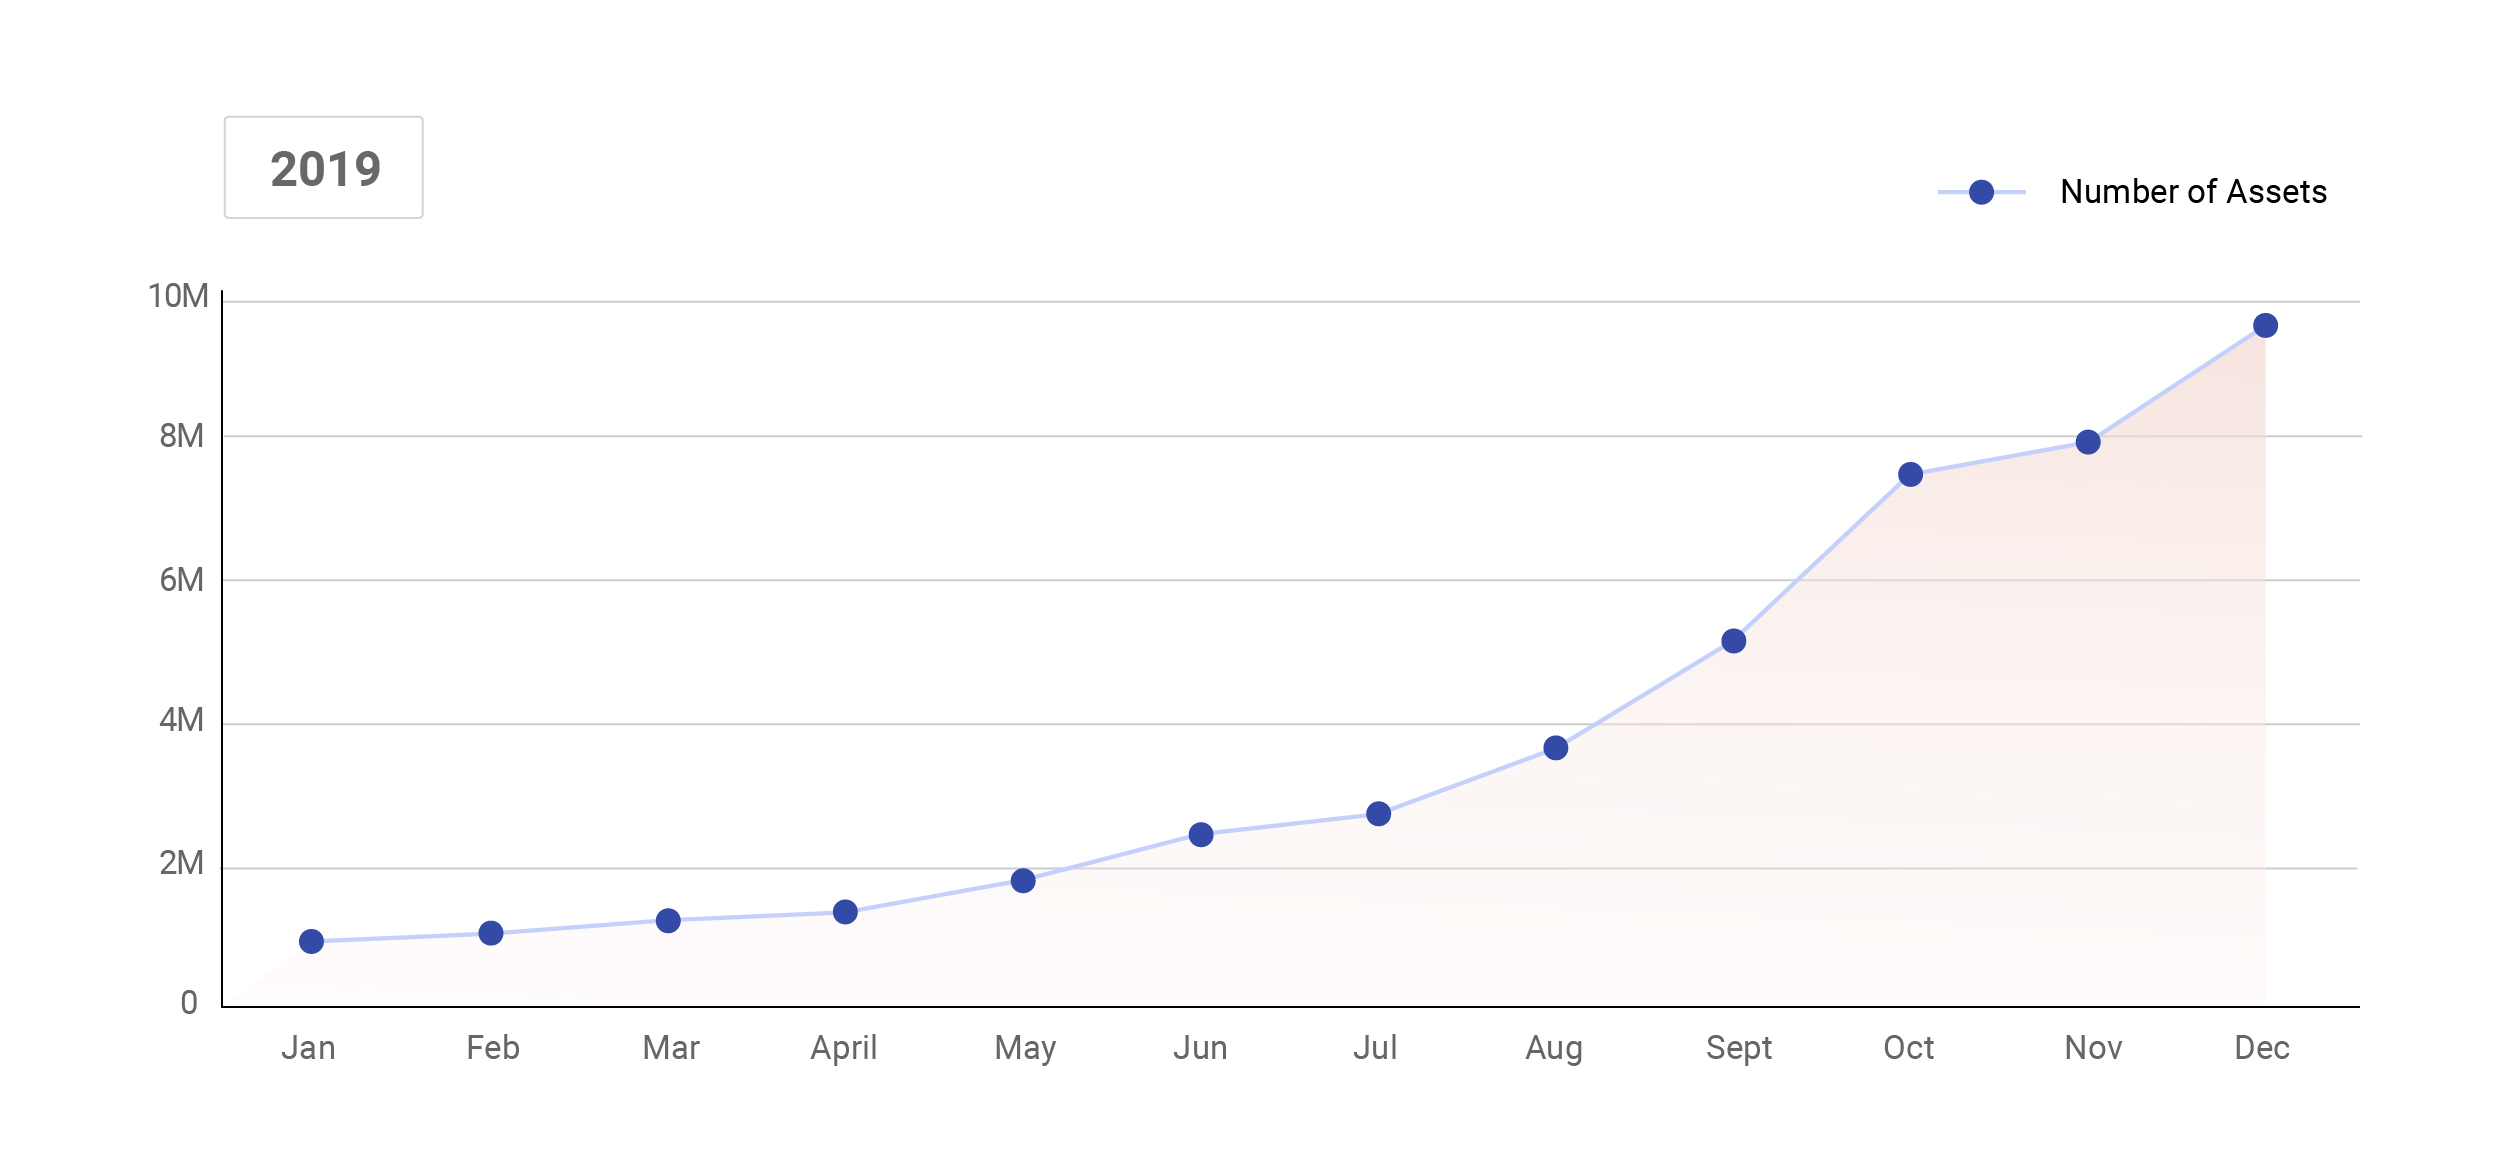
With over 9 million assets, data has been accumulating. What’s a media management company to do?
Share the data with you!
Our friends at Backblaze have been letting us all nerd-out on their quarterly hard drive stats, and that gave us the idea to create this report from our own data in iconik. Enjoy!
Industries Using iconik
The traditional MAM/DAM market was once predominantly made up of the film and broadcast industry, but now it’s really diverse. These are the industries represented in the iconik user base. All industries are defined by the GICS model.
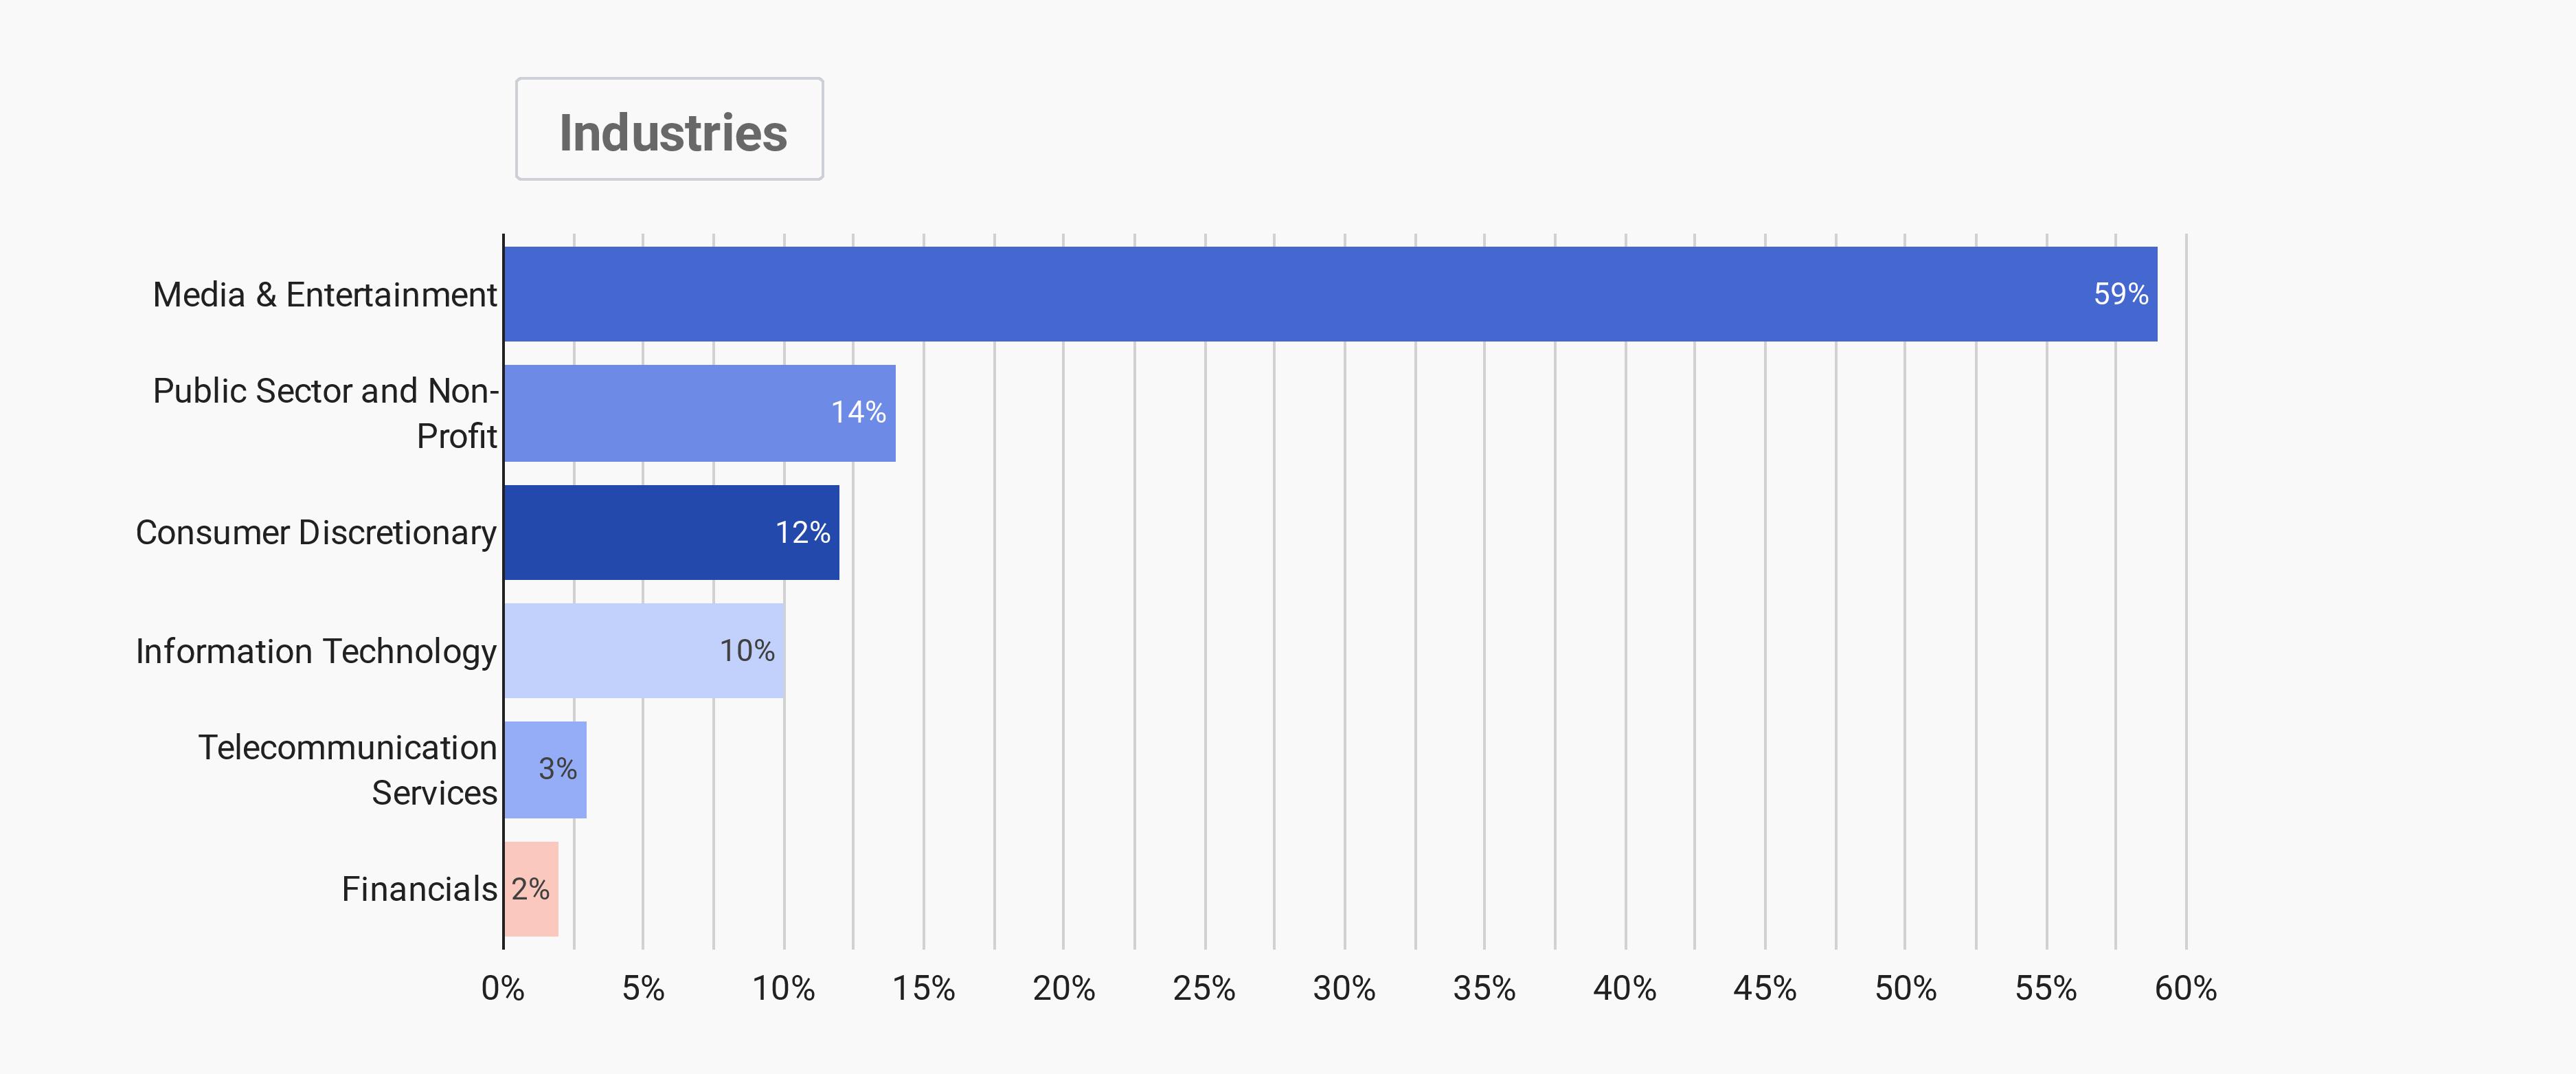
Why are these users so diverse? Companies, regardless of their industry, are finding that media is the most effective way to communicate internally and with their market. Today, prominent businesses in every vertical are becoming “media companies”.
During this shift, these organizations are learning that they need to:
- Manage projects and cross-team collaborations from anywhere
- Uphold brand integrity
- Integrate with rich media production tools
- Have a process to serve the full media lifecycle
They use solutions like iconik as they tell their corporate stories with media.
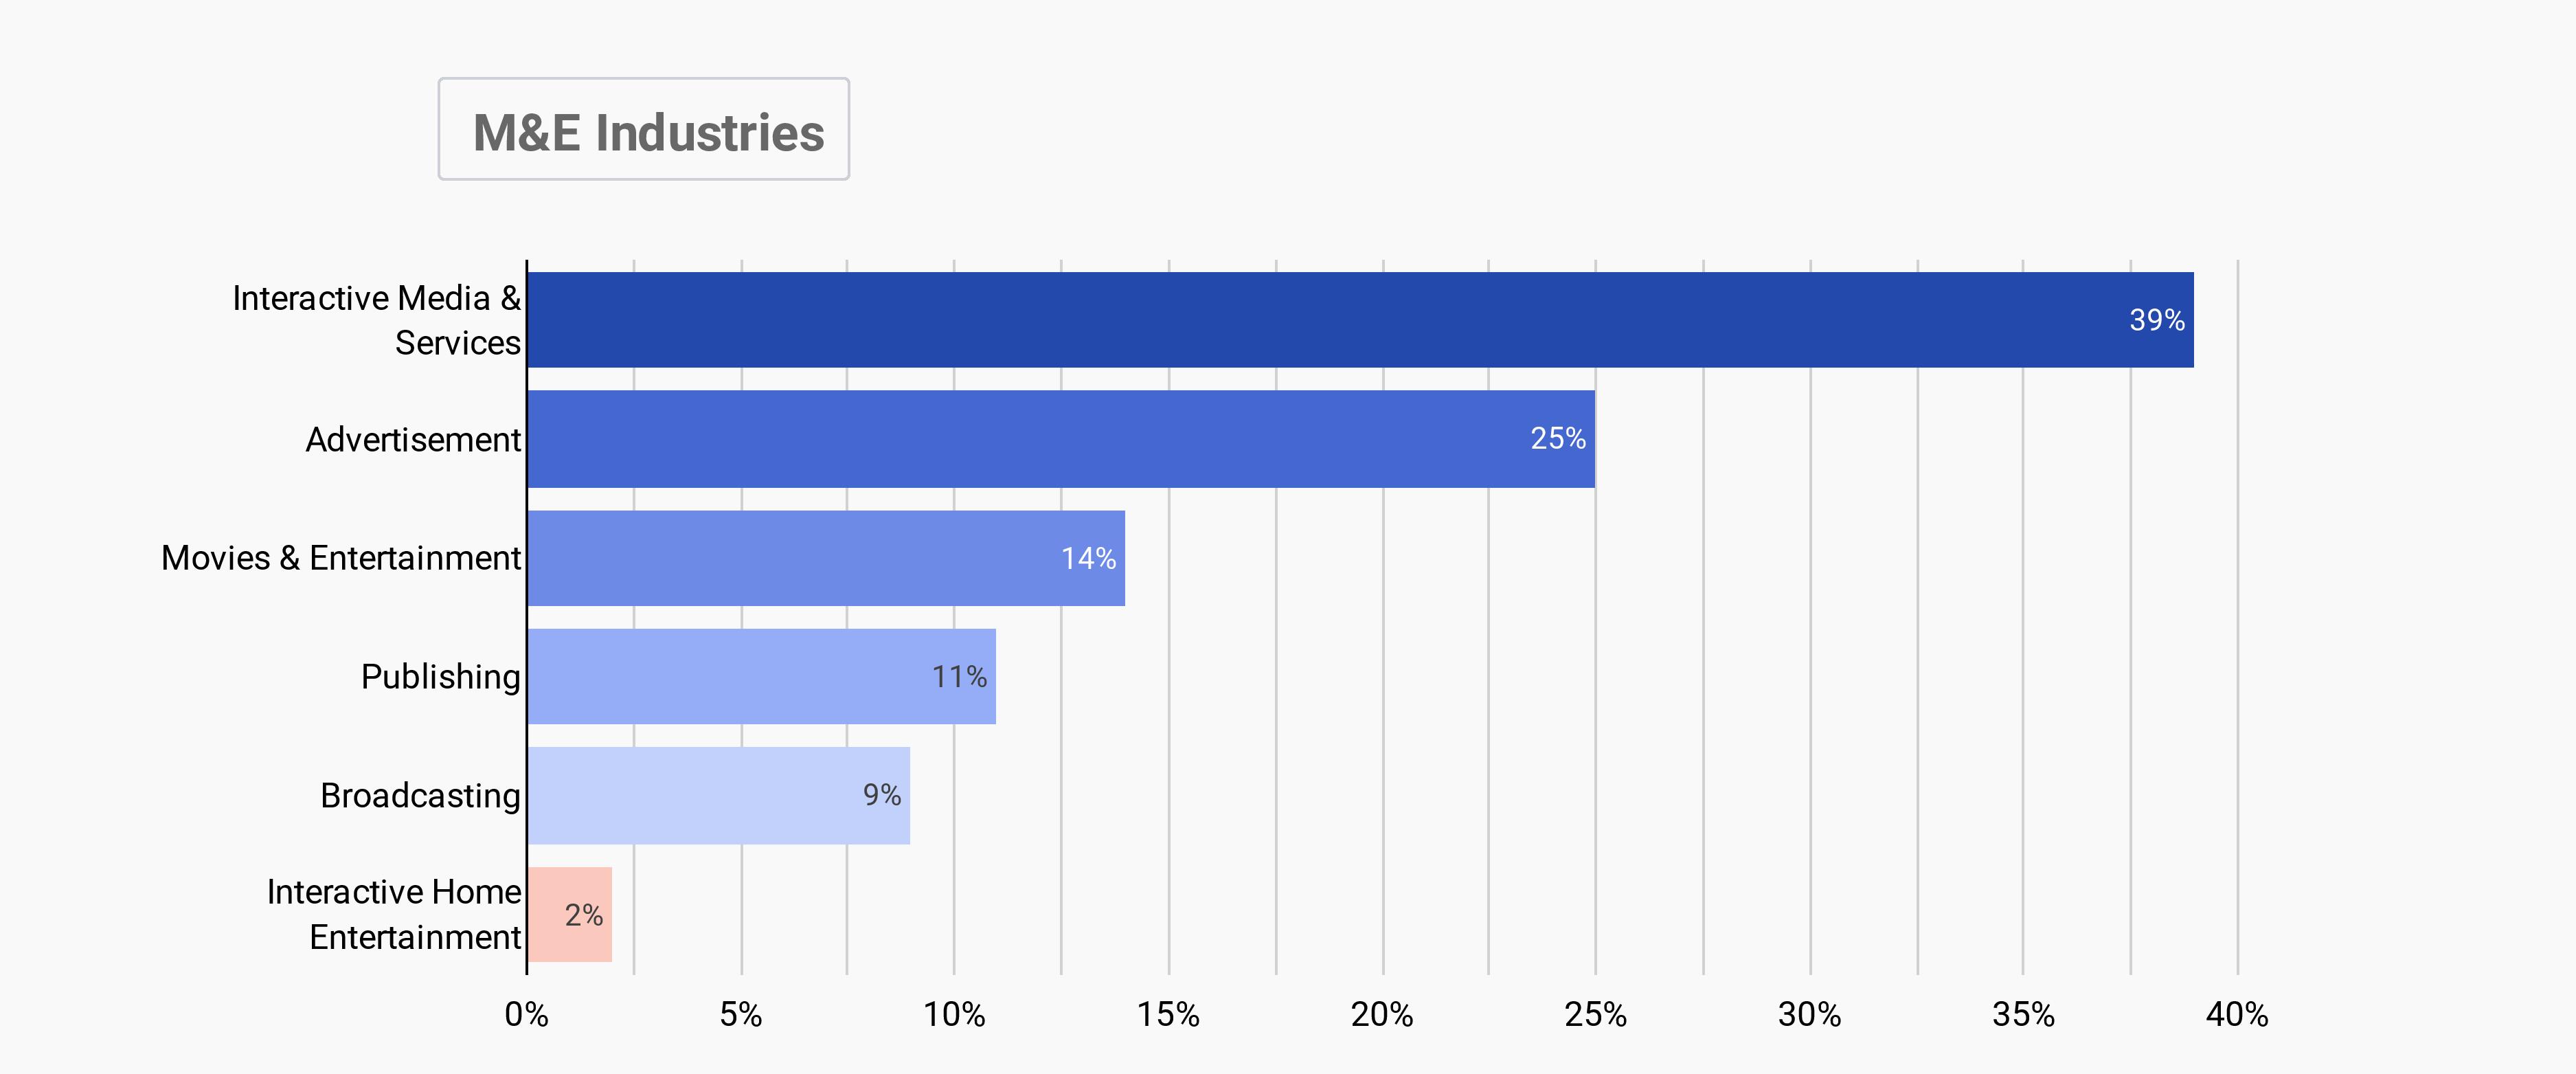
The Media and Entertainment Industry in iconik
The Media and Entertainment industry makes up the majority of our customer base. This was to be expected as media is the lifeblood of their organizations. Again, using the GICS model, we have broken down the Media and Entertainment industry into its sub-categories.
Media Statistics
Here, we will look at what type of assets are in iconik and where they are stored. Only original files added by our customers will be counted in our data—proxy and other files will be excluded. We are looking for trends that show how media and its usage in organizations are changing. We’re especially interested to see what’s happening with video across all the industries we serve as well. So how many assets are in iconik?

This year, there was a massive increase in total assets. Some customers brought decades of archive data, and some were media outlets that came with an extremely large amount of content, and much of that goes through iconik during production.
Is an asset a file?
No, an asset is a container that consists of at least two files. Within a single asset are:
- A container
- An original file
- Various formats of that file, e.g. proxy, mezzanine, etc.
- Technical and user-defined metadata (both on the asset and time-based level)
- ACL's (access control lists) and permissions
- And other files.
How much data is that?

Again, that doesn’t include any proxy files in iconik. When our assets doubled during the last quarter of 2019, performance remained steady. Our customer’s remained satisfied and stayed with us for the ride. Because iconik was built for the cloud, it took full advantage of the benefits of cloud elasticity. Every component in iconik is scalable, so the entire system expanded smoothly with our users to accommodate their new data.
Original File Storage
With our “Bring Your Own Storage” model, iconik users can choose to use their existing cloud or on-premise storage. Proxies and metadata are always in the cloud, but the original files can live anywhere. Storages included in the “other” classification include Wasabi, Azure, and Cantemo Portal.
You can drill down into each storage and industry in the chart below to see what the file type distribution looks like for each one.
Click an industry or segment to see the data change.
This chart shows that 47% of original, or full-resolution files are stored on-premise and being managed with an iconik Storage Gateway (ISG). These are local storages like a NAS, SAN or computer. When these storages with original files are synced to iconik, our customers can use proxy workflows to make their processes more efficient.
We haven’t been keeping historical data to show where files are stored over time, but we will begin to collect that for future reports. The aim is to show trends of where files are being stored, e.g. cloud adoption over time.
Cloud vs. On-prem
The hybrid cloud model allows users to choose where to store files during their lifecycle. Depending on business logic or production workflows, storage can change, but iconik tracks where everything is by keeping it indexed and searchable in the cloud. We wanted to see the distribution rate of files between cloud and on-prem storage. Here’s what we found.
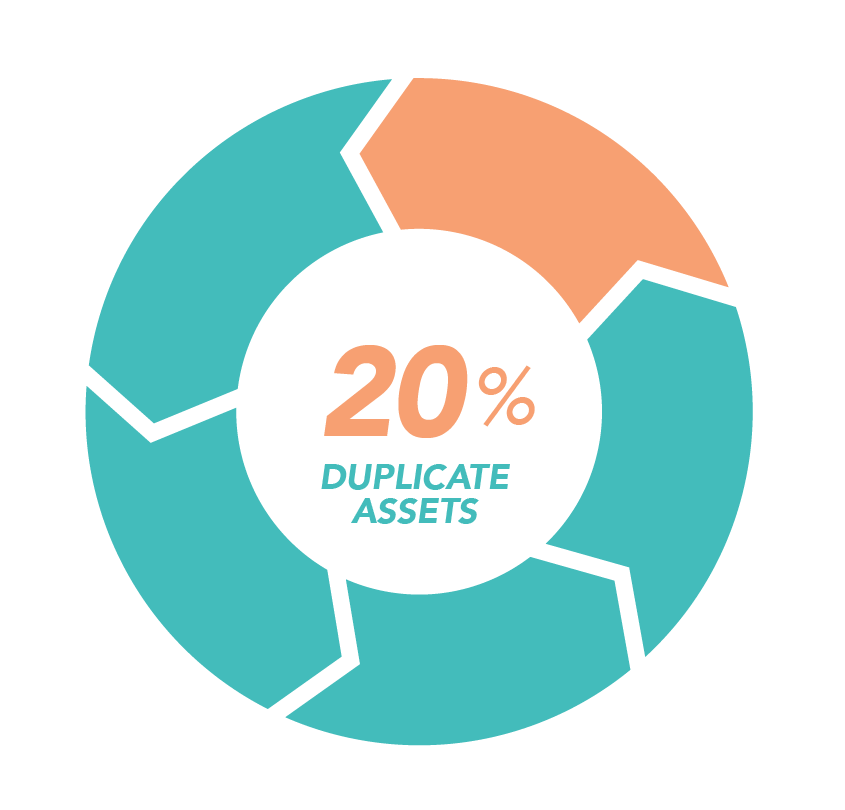
Duplicate Files
Some iconik customers have duplicate files by design. Having the same files locally as well as in the cloud works extremely well when there is constant collaboration with remote teams. Other customers keep files in multiple cloud buckets with multiple cloud providers for backup reasons.
Other times, duplicate files are unwanted and require extra costs. iconik can scan and detect if a file already exists through its checksum. If there’s a large occurrence of this in iconik, we can notify the customer. But with the complete view over all storages in iconik, it’s easy to find your unwanted duplicate files on your own. About 20% of the files in iconik are duplicates.
Types of Assets in iconik
iconik was primarily created for rich media like video, but it can be used for more than that. Here are the types of files our users are managing in iconik.
36% of iconik assets are not media. Our customers use the standard iconik functions like metadata, sharing, ACL’s and download features to help them manage all types of files. It’s also interesting to see that While video is only 17.5% of the assets in iconik, video still makes up 78% of the total data in iconik.
How Much Video is that?

Video reigns supreme in iconik, and in 2nd place is audio with 39.8k hours, about 4.5 years worth of listening.
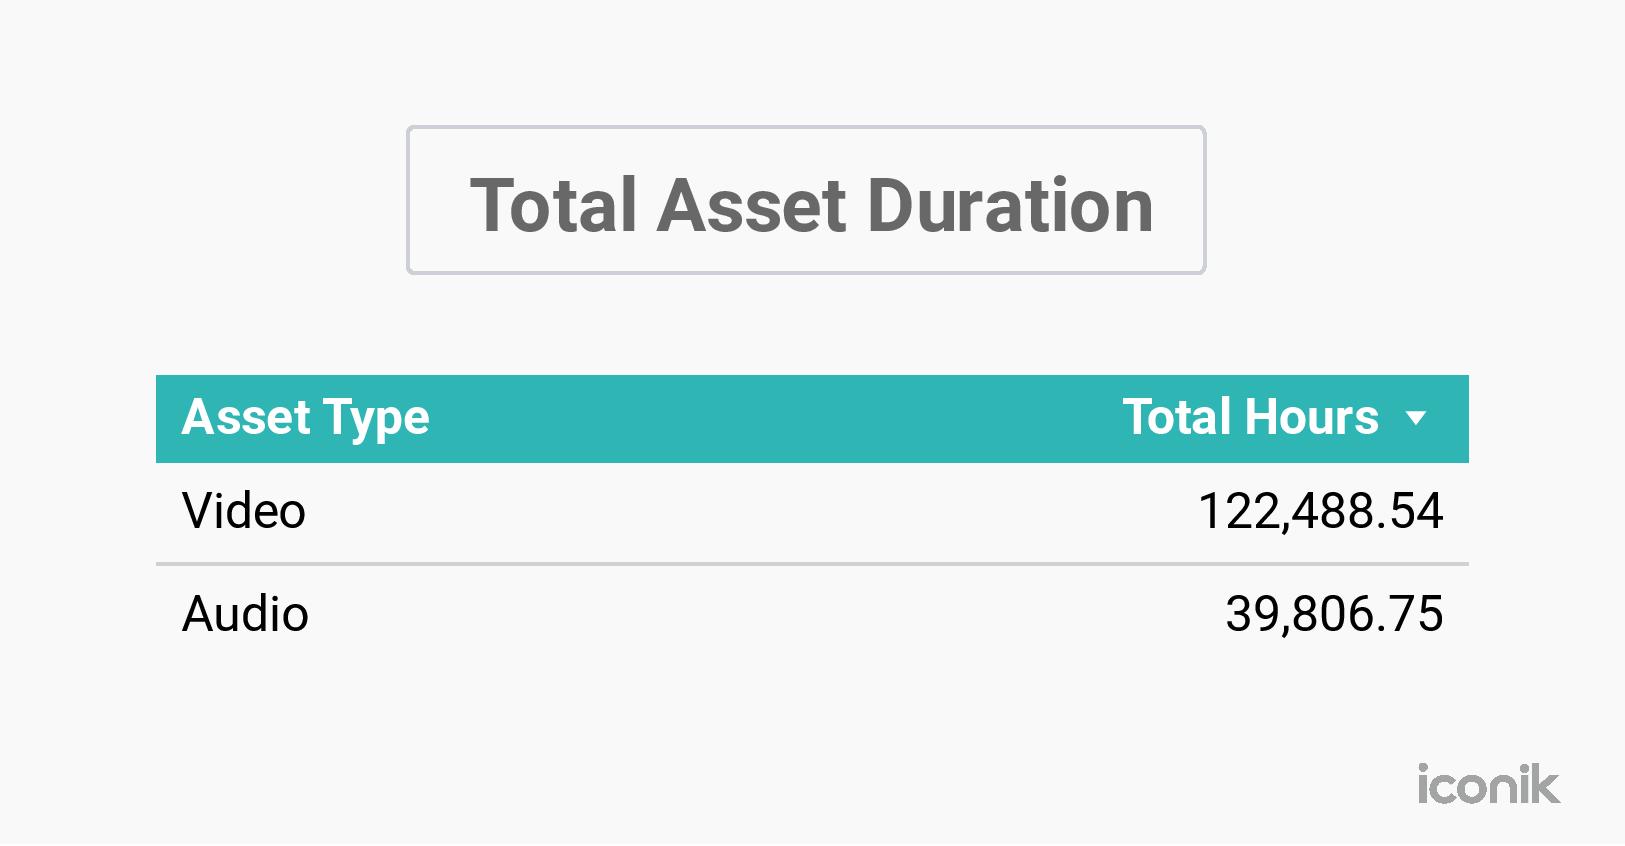
14 years of video is a lot to go through. We can dig a few levels deeper to see what kind of videos iconik has and how that has changed over time. Note: All graphs with a time axis have been generated using only files with the creation date set in the XMP or EXIF metadata. Files without a creation date have been omitted.
MPEG-4 videos (65%) have been consistently been the majority since 2006 while ProRes video has risen to 25% since 2009. One format included in the “Others” category is RED. We know that RED files are common with our users, but to date, iconik has had limited support for these. This accounts for their small percentage here. RED support in iconik will continue to improve and its percentage will grow in future reports.
This is how the resolutions look for the 122.5k hours of video in iconik. 1080p resolution is most common with 51%. 720p (17%) and SD video (14%) are nearly tied for 2nd most common resolution. We’re seeing a rise of 4k content and we expect that to continue to rise. Soon, we anticipate a similar growth for 8k content as we saw for 4k in previous years.
The devices we view content on have changed and the data around aspect ratios follow the trends you’d expect. We moved away from 4:3, which was standard for the 20th century and even in the 21st, towards the wider 16:9. Today, about 75% of iconik video is 16:9. Over time, you see the pink (4:3 ratio) disappear.
Conclusions from the Data
We have been trying to make media management simple, knowing that media is becoming an important part of every industry. Seeing the growing diversity of our customer’s industries was confirmation to continue on this path.
What was surprising though, was the relatively small percentage (17%) video actually accounted for in our total assets. While video still makes up about 78% of the data in iconik, image assets came out as the most common type of asset, making up 40% of our total assets! And non-media assets accounted for 36% of iconik assets—showing us that iconik can efficiently manage the many types of files in an organization.
When we set out to explore our data we had a long wish list of points we’d love to see and present to you. As we dug in, there were a few areas with surprisingly little data. This entire exercise of collecting and reviewing our data has shown us how to become even more data-driven as a company, and where to invest our efforts to gain more valuable data for future media stat reports like this.