TL;DR:
Remote work has increased the usage of cloud-based solutions like iconik.
- iconik's asset count has increased by 293% since December 31, 2019, managing over 28M assets.
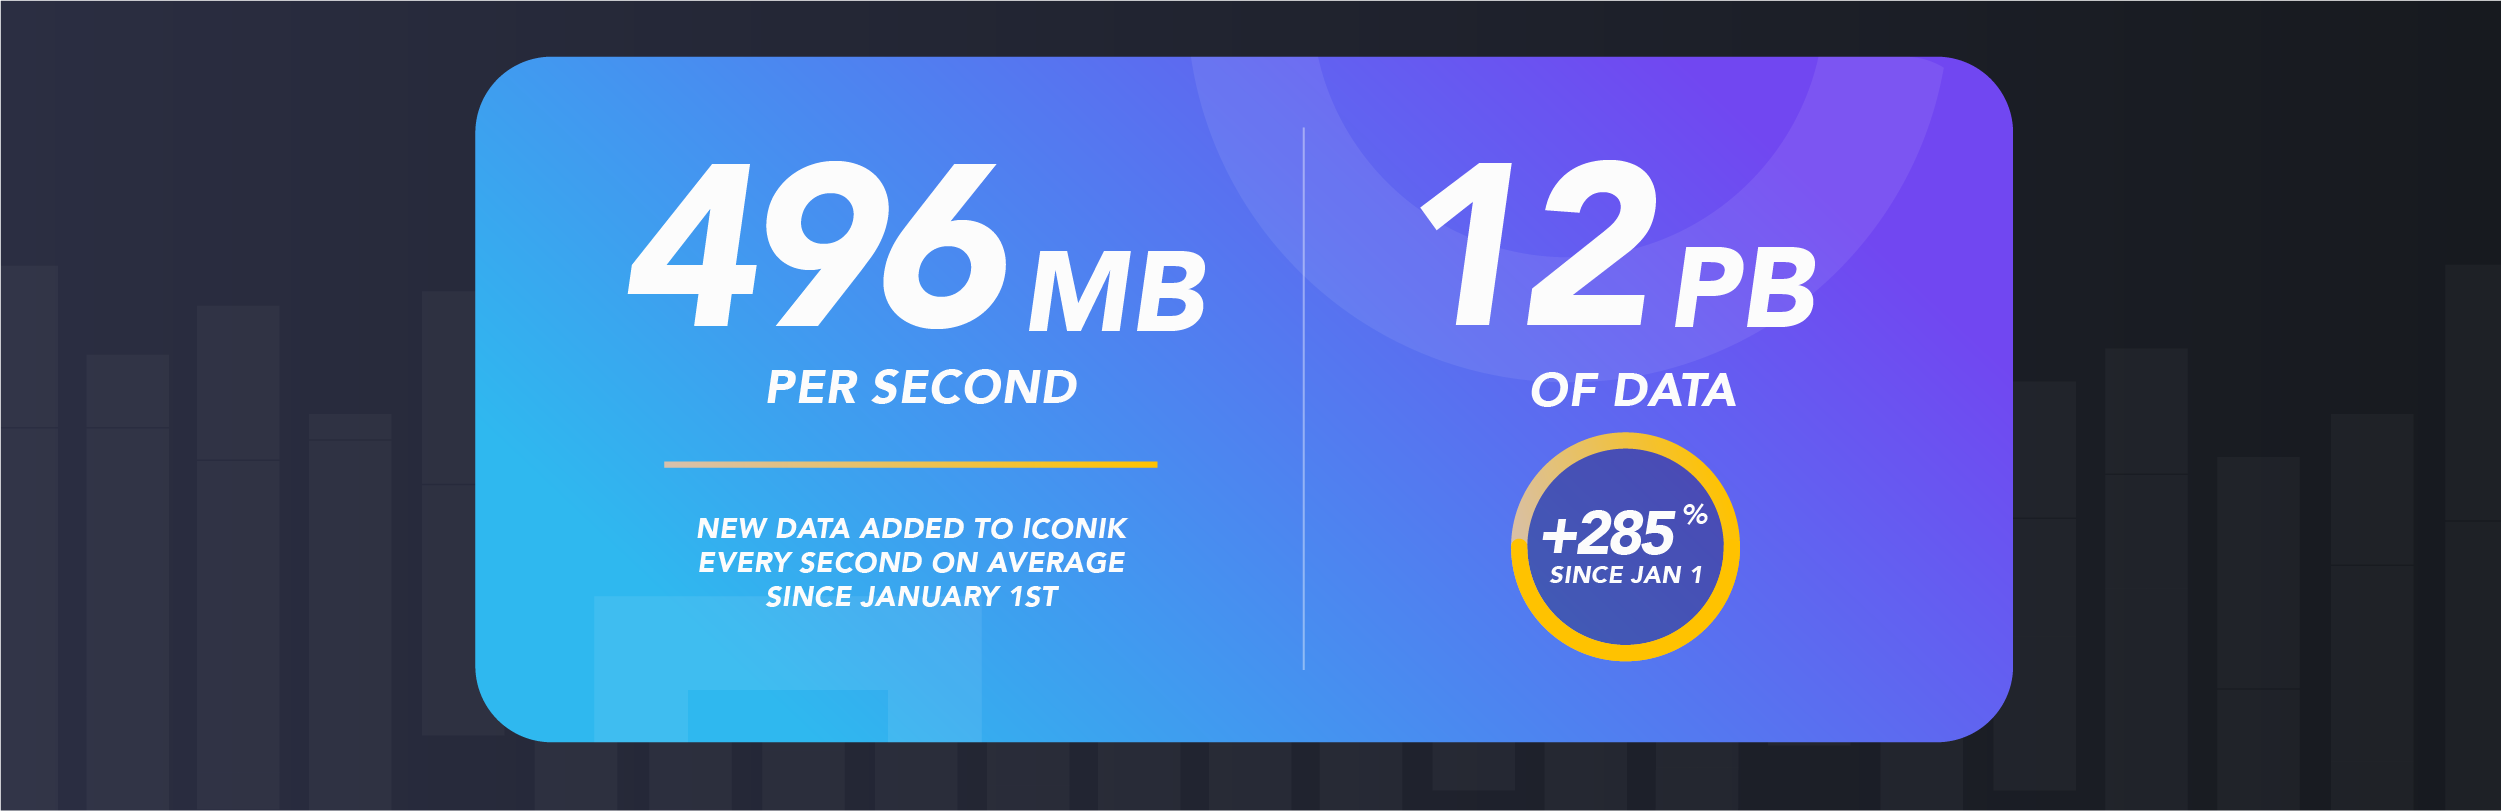
- iconik data has increased by 285.7% since December 31, 2019, rising from 4.2 PB to 12 PB of data.
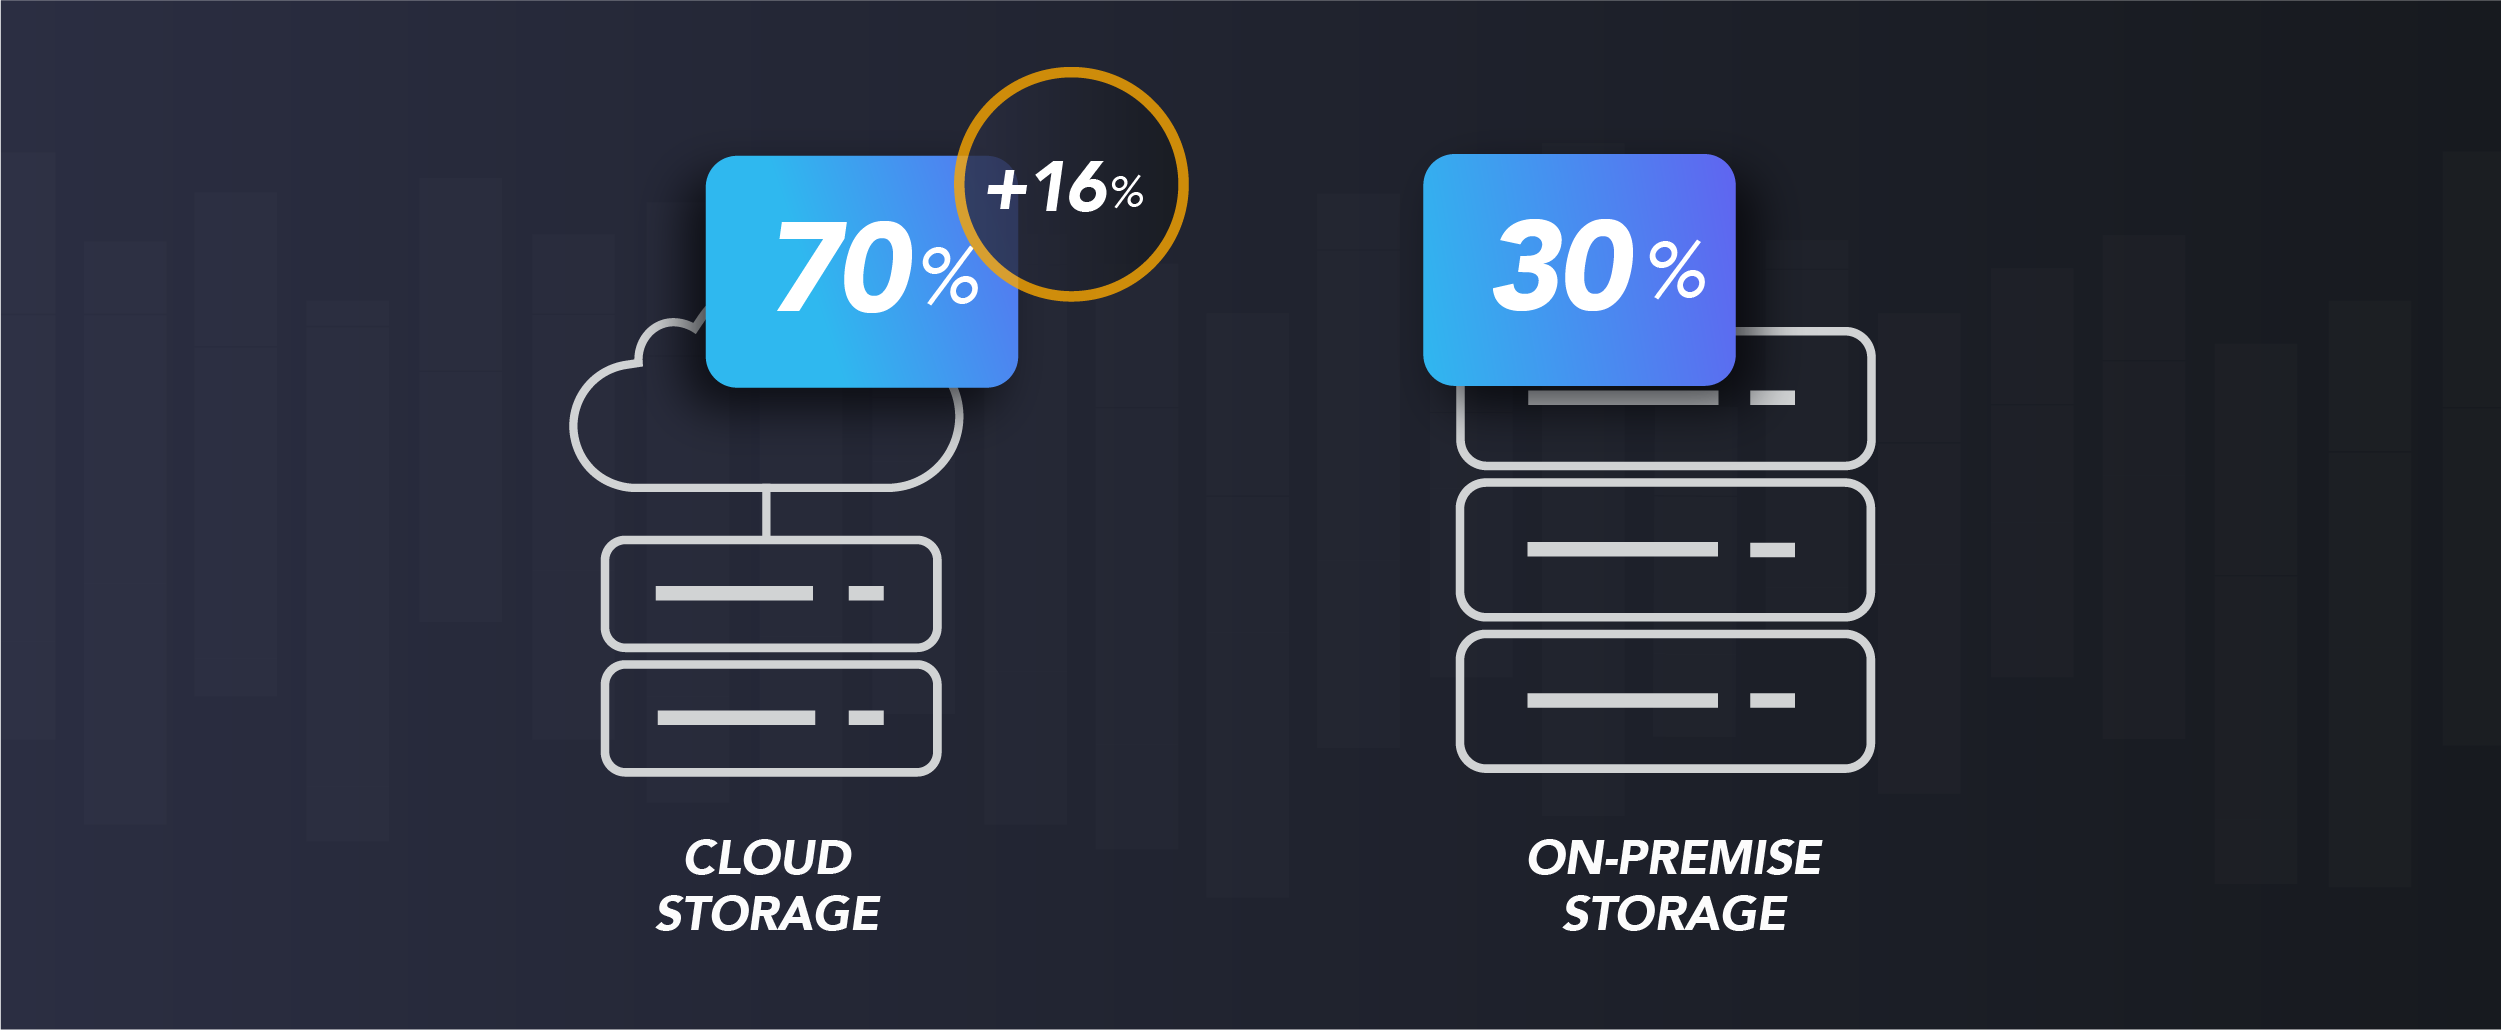
- iconik customers are using the hybrid cloud, with 16% more hi-res, original assets stored in the cloud making the storage split 70% cloud / 30% on-prem.
- Rising usage trends are visible with over 140 API calls per second in June alone.
- iconik manages about 30 years worth of video, and 13 years of audio.
Since our first iconik media stats report, we’ve received so much positive feedback in response to sharing our data. This has confirmed our original sense that there is a lack of raw data and stats in the media tech space to objectively see how media workflows are changing across industries.
2020 has been “interesting”, to say the least, and we’re excited to share this new data with you.
The Effects of COVID-19 on Media Management
In this 2nd edition of our iconik media stats, we will look at the trends that have emerged during the COVID-19 pandemic. Businesses have been experimenting with new operation models and tools that work with a decentralized workforce. The data in this report will show how the rise of remote work is affecting how people manage their media.
COVID-19 and the Rise of Cloud-Based Tools
At this point, so far into this pandemic, stating this seems redundant, but the iconik data shows it again that cloud-based solutions are being used more.
The above graph shows a rising trend for iconik unique daily logins as more teams needed to access media remotely. At the beginning of March, before most lockdowns were enforced, we saw more customers increase their usage in what we believe were pre-emptive measures to prepare for remote work. As teams became more dispursed, more collaborators were logging in every day.
During this time we saw another measure of iconik activity, the number of API calls made to iconik.
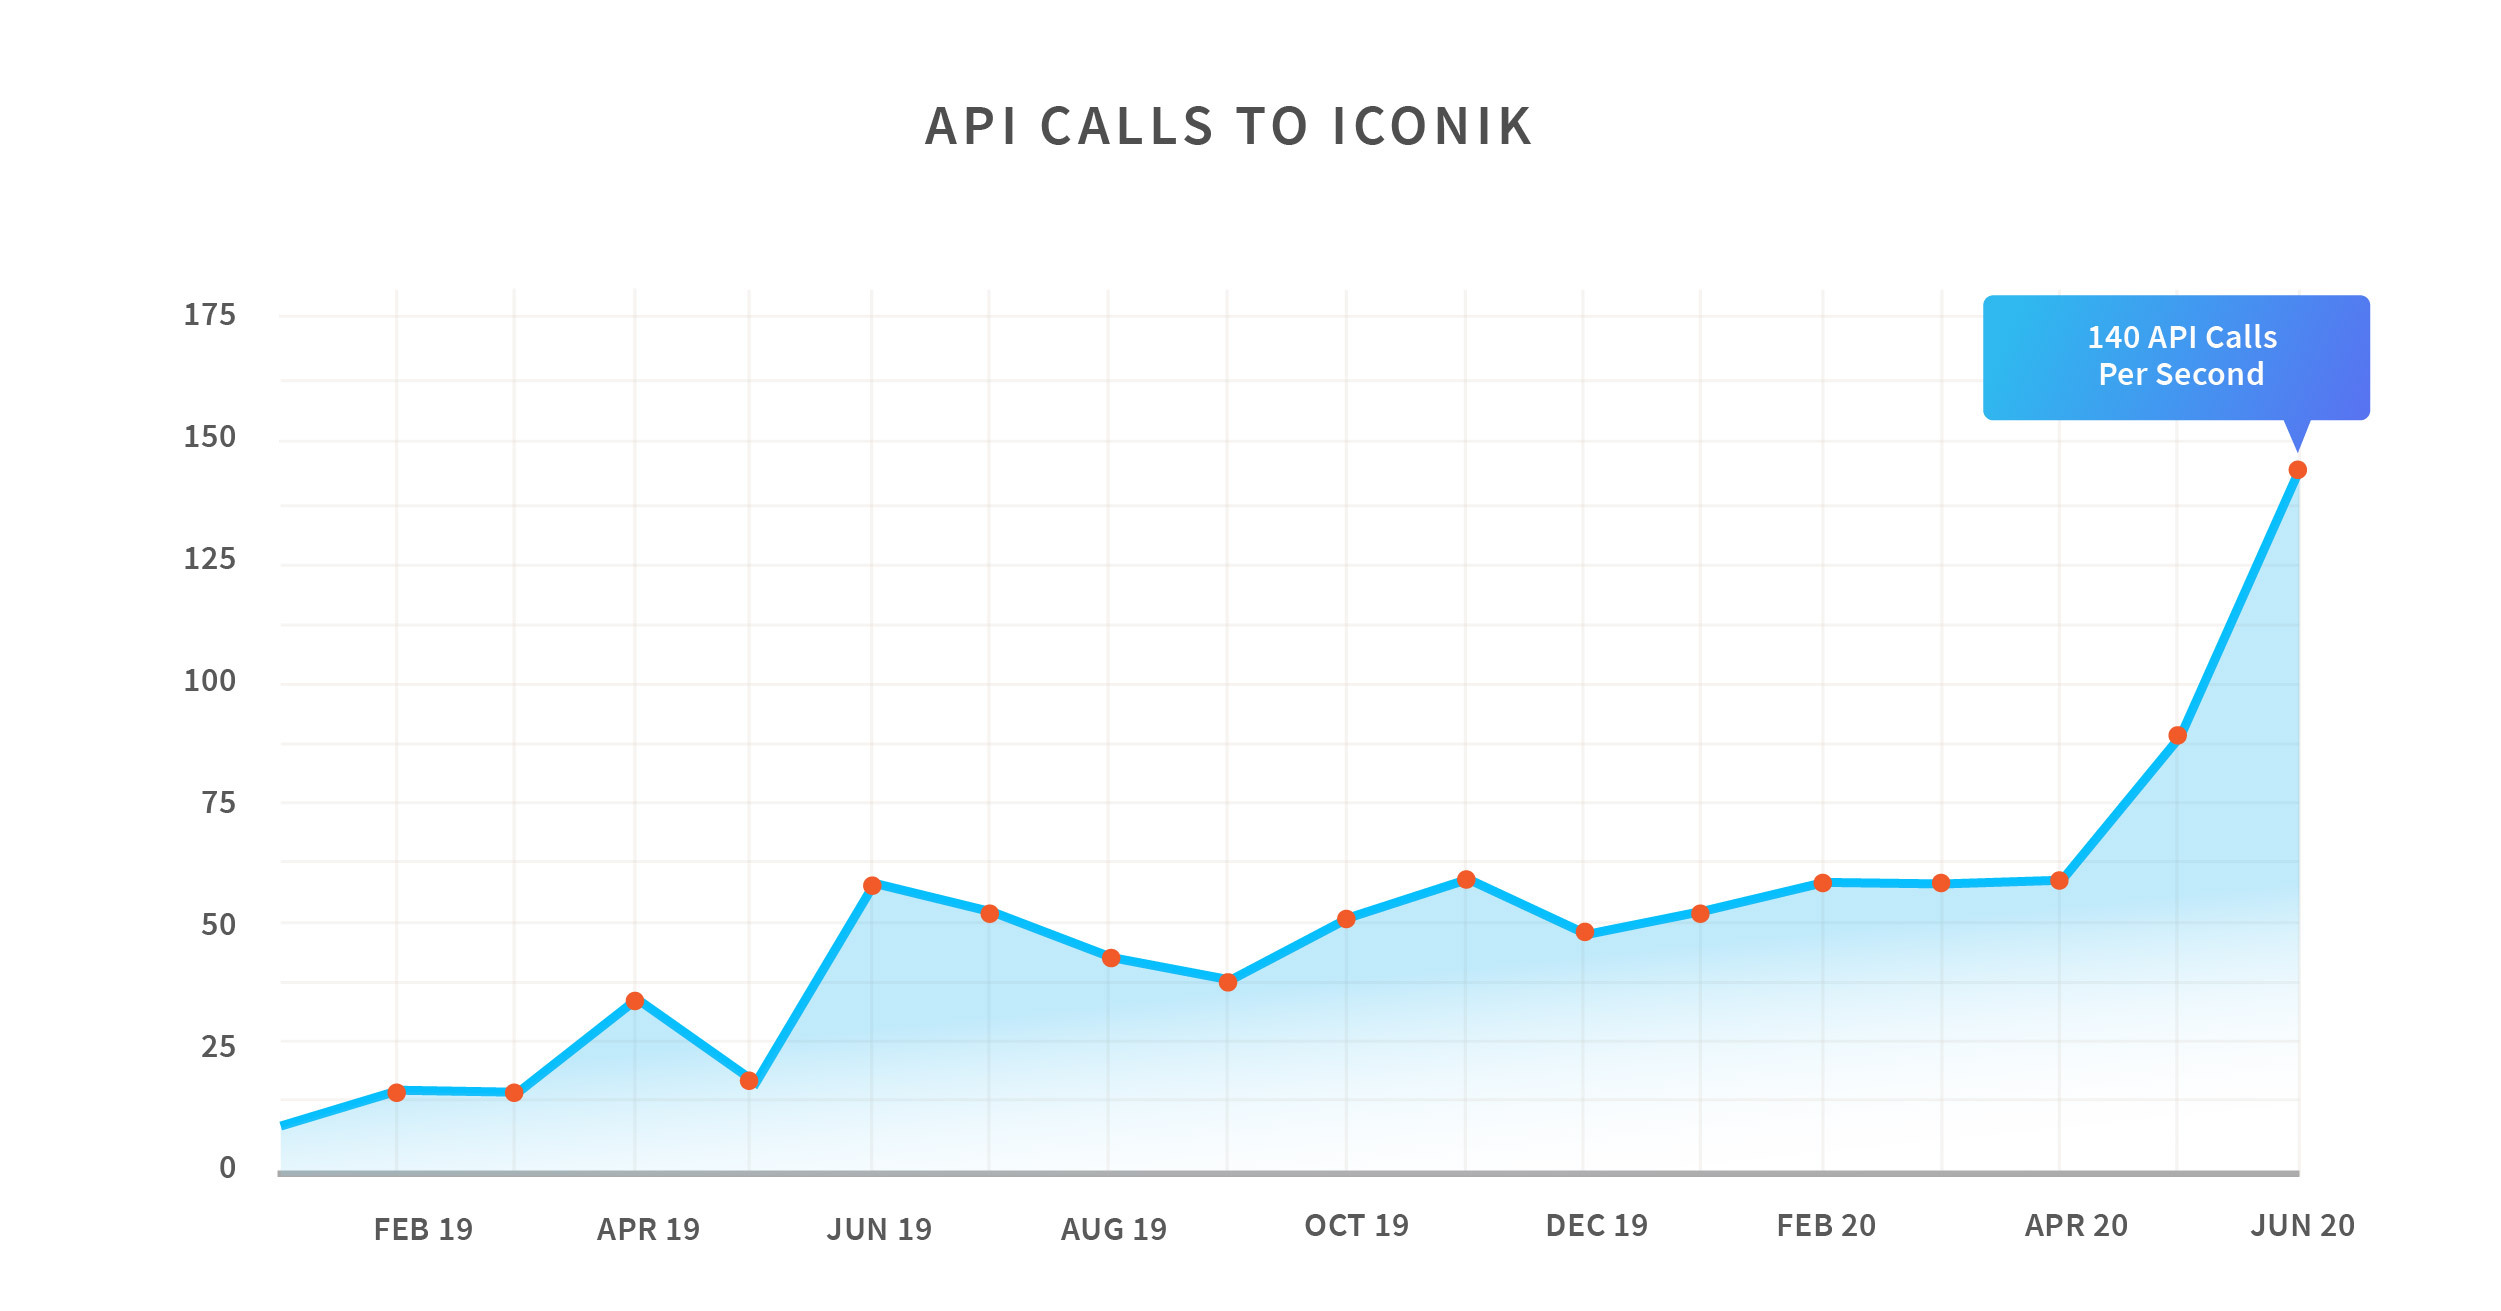
The iconik frontend uses the same API as 3rd party integrations, so this data indicates that usage of API integrations and custom iconik actions has increased. June saw a continued sharp rise up to 368 million API calls, over 140 API calls per second.
More Media is In the Cloud
As teams moved away from their offices, there have been some significant changes in where iconik customers store their media. Customers are storing more of their hi-res media in the cloud.
Your interactive charts are loading below.
The most notable change here is the smaller portion of original, hi-res files stored on-premise. The iconik Storage Gateway (ISG) manages on-premise storages like a NAS, SAN, or computer hard drives.
Data in iconik Has Tripled
The necessity of remote work has resulted in more organizations using iconik as well as wider adoption with existing iconik customers. Today, iconik manages 28.1 million assets—a 293% increase since the end of 2019. Month to month, the growth of assets in iconik has been fairly steady, but just looking at our highest peaks in 2019 vs. 2020, we see a dramatic increase. In 2019, October had the highest number of new assets in a month with nearly 2.5 million. In June of 2020, we peaked again with over 4.4 million new assets, 176% higher than last year’s highest month. Cloud adoption was already on the rise, but the current climate has accelerated this shift to the cloud and hybrid cloud.

It’s expected that this year, more than 59 zettabytes of data will be created and consumed globally. With our increased reliance on digital solutions during COVID-19, there has been a significant spike in the global datasphere. This was also reflected in iconik with a rise in our own data. Since December 31st, 2019, the amount of data managed in iconik has risen 7.8 petabytes (PB) from 4.2 PB to 12 PB. That’s 496 MB per second! To get an idea of how much it would cost to store that much data on-premise, we checked retail prices for 16 PB of spinning disk storage. The cost? About $375,000—same as a new 2020 McLaren 720S.
What industries are using iconik?
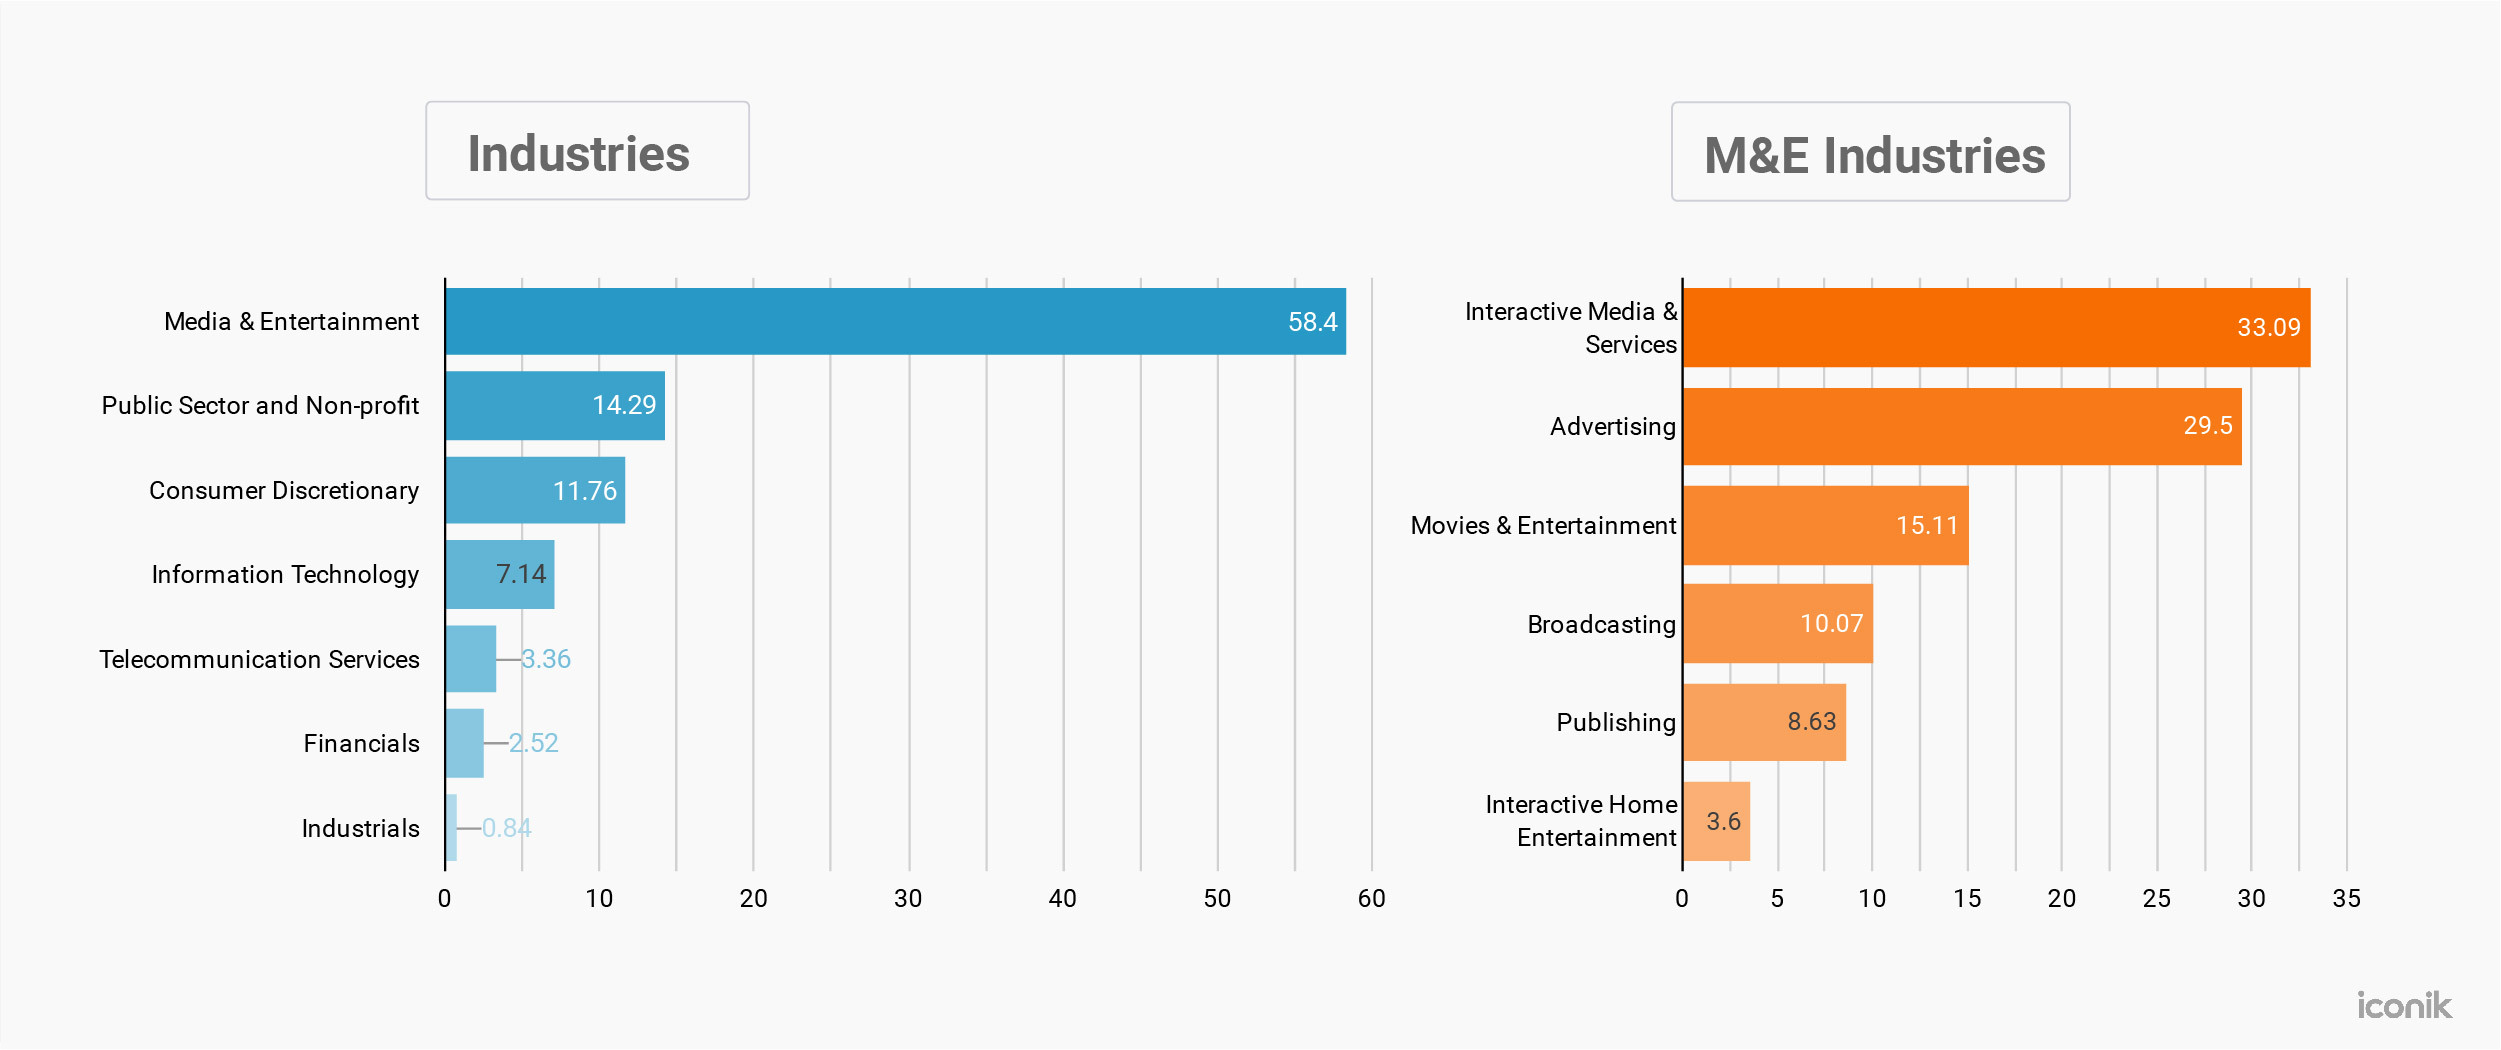
We continue to see businesses in every industry are becoming “media companies” who share information and their brand stories through video and other media. All industries are defined by the GICS model. These segments have not changed by much during the last six months, with most seeing a 1-2% difference.
The media and entertainment industry is still clearly the most mature market for media management. ROI on media has a much bigger impact on the bottom line for M&E companies as media is their product.
Types of Assets in iconik
iconik was created for video first, but it is used to manage much more. Here are the types of files our users are managing in iconik.
This breakdown of assets has remained consistent with the last report. Video still makes up the majority of the data with 70.6% while only representing 17.3% of the assets in iconik. The “other” category represents 30.3% of iconik assets. This demonstrates that the standard iconik functionality like metadata, sharing, ACL’s, and download features is helping our customers manage all types of files.
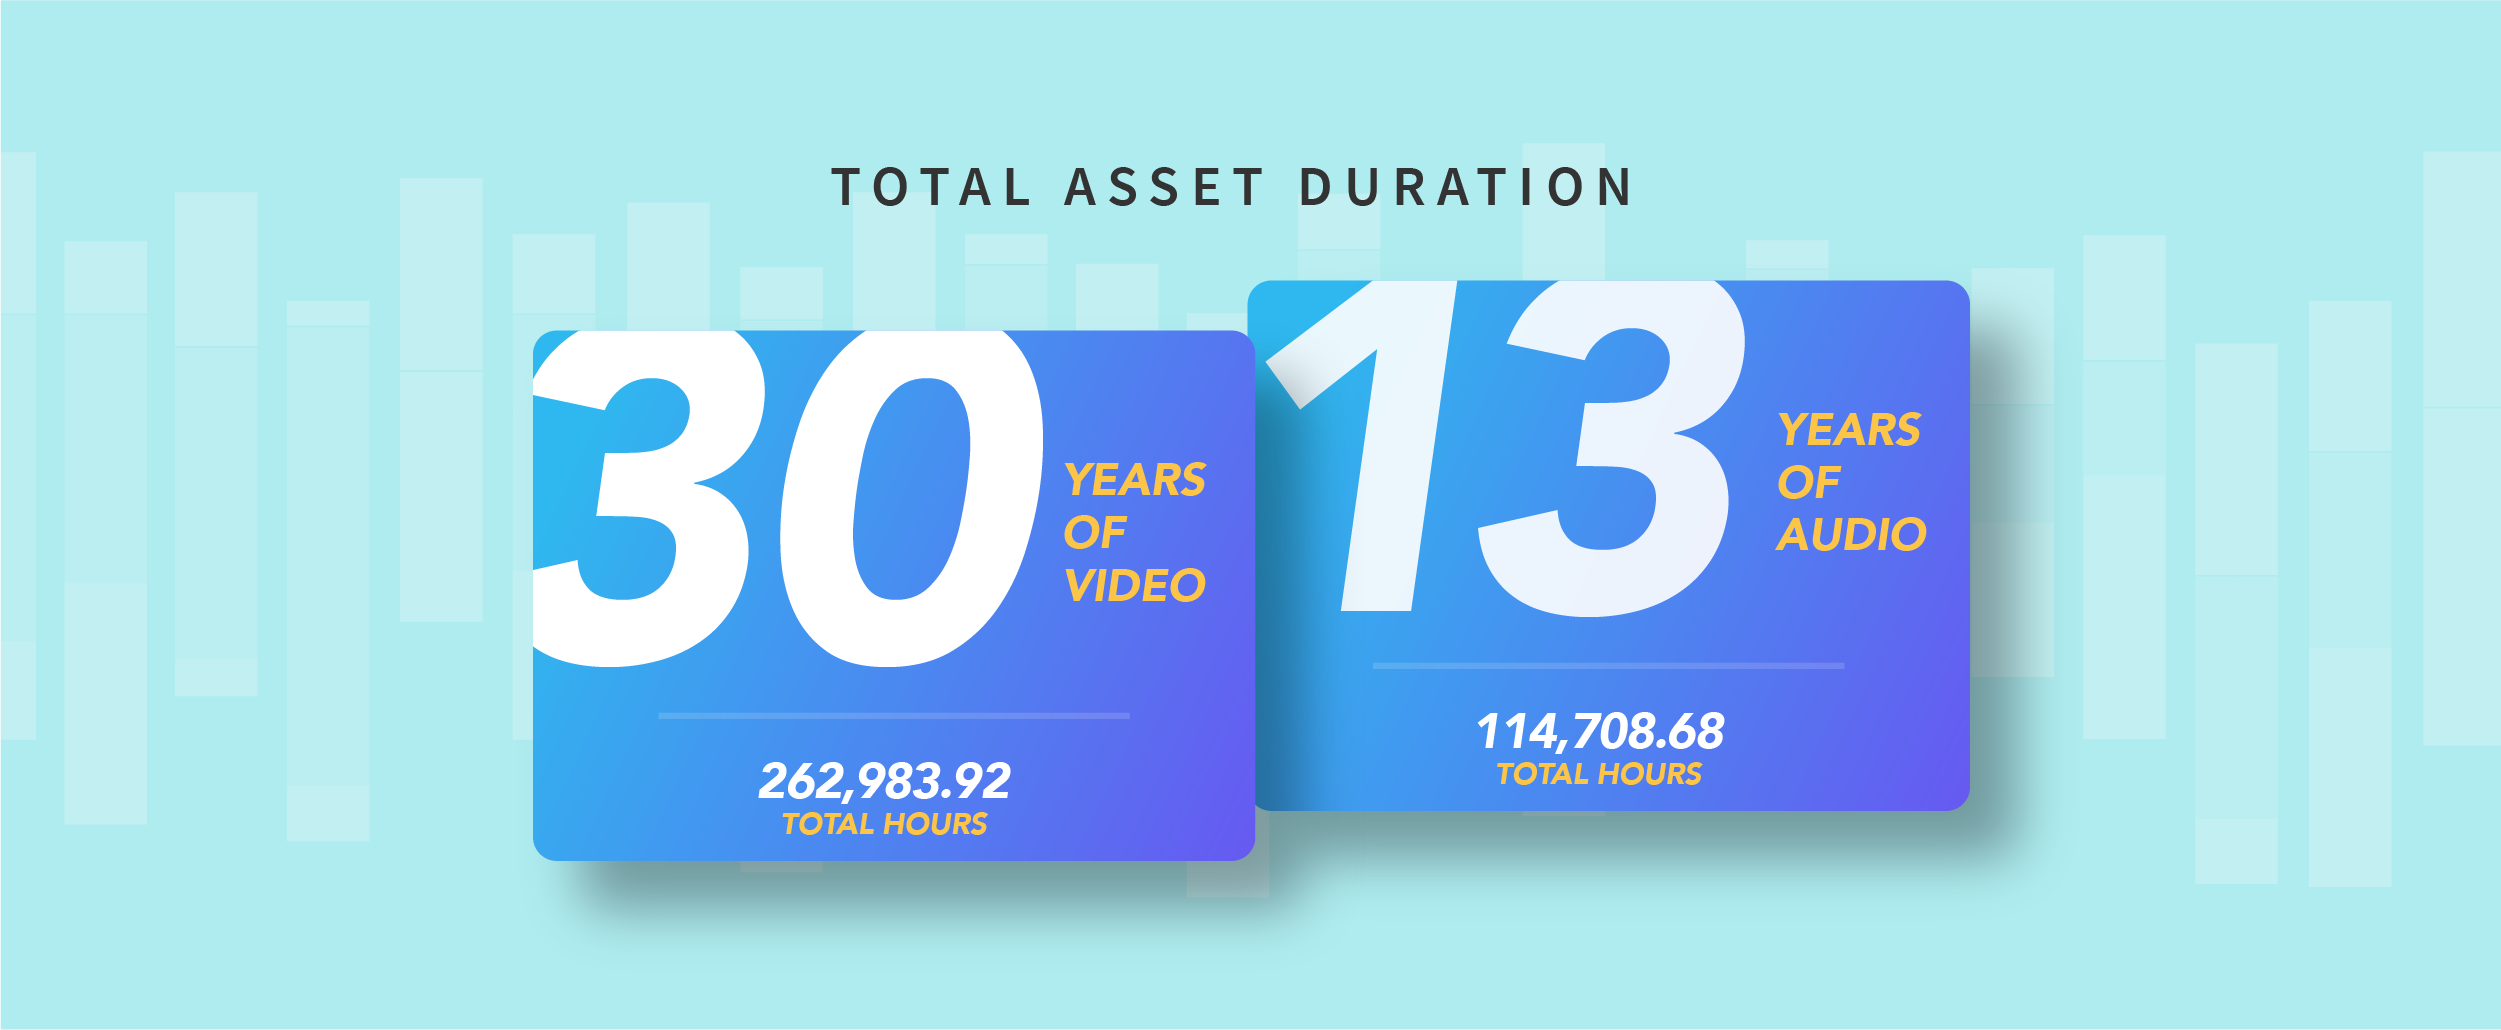
That’s about 30 years of video and 13 years of audio. If you had started watching iconik videos in 1990, you’d just be finishing up this year—then probably evaluating if this was a good way to spend 30 years of your life. 🤔
The video data in iconik allows us to see how video trends have evolved over time. Note: All graphs with a time axis have been generated using only files with the creation date set in the XMP or EXIF metadata. Files without a creation date have been omitted.
Video formats and aspect ratio trends have not really changed at all, but video resolutions show that 1080p content has increased by nearly 10%. These recent trends may not be very dramatic, but looking at the longer historic data, we can see the evolution of video that has occurred over the past decades.
COVID-19 Changed the Way We Work
The data in this report shows that over the last few years, there has been a trend of organizations from every industry digitizing their media workflows and moving towards the cloud and hybrid cloud. The 2020 pandemic has clearly accelerated this trend. There is a new normal being established with how we store media. It’s clear that cloud-based and hybrid cloud media workflows are here to stay.
The data has also shown us that as more companies have become decentralized, more content has been added to the cloud for remote collaborators to access. This could be hi-res content in the cloud or low-res proxies representing on-premise files in a hybrid cloud structure.
Even during difficult times, the data demonstrates that creators and organizations continue to share their stories with media. We look forward to seeing how these changes continue to affect iconik data in our next iconik Media Stats report.
Note to the Community
We want to acknowledge that many companies are still struggling during this time. If your company needs a new solution for managing media, storage, or video collaboration, we’re available to help you discover options that make sense for you and also offer $300 worth of iconik credit to help you evaluate if iconik is what you’re looking for. Reach out to us today.